
[ad_1]
I always get excited when an indie game developer releases a post
mortem. A detailed
writeup describing how their game sold after launch, along with insights about
what did and didn’t work. I currently don’t have any games for sale, but since
launching itch.io, the open indie game marketplace, I’ve
collected a lot of data from a store’s perspective. Although I’m not one of the
larger marketplaces (yet), I still think it’s interesting to see how things
grow and what drives purchases.
I’ve typically been very open about releasing
data about how the
site has been progressing. Sadly I haven’t been very consistent so I decided to
spend some time learning R and write some scripts
to generate graphs for some of my core metrics.
Overview
itch.io is an indie game marketplace. Any developer of a game can upload their
game, design their game’s page, link a payment provider, and start selling. (Or
they can upload a free game, more details about that below.)
itch.io supports PayPal, Amazon Payments, and Stripe. These three payment
providers all support a special kind of marketplace API that allows itch.io to
facilitate a payment to an individual’s account while optionally taking a
percentage of the transaction. itch.io currently takes no cut of any
transaction as a (very long) promotion. All money received is sent directly to
the developer after the payment provider takes their cut.
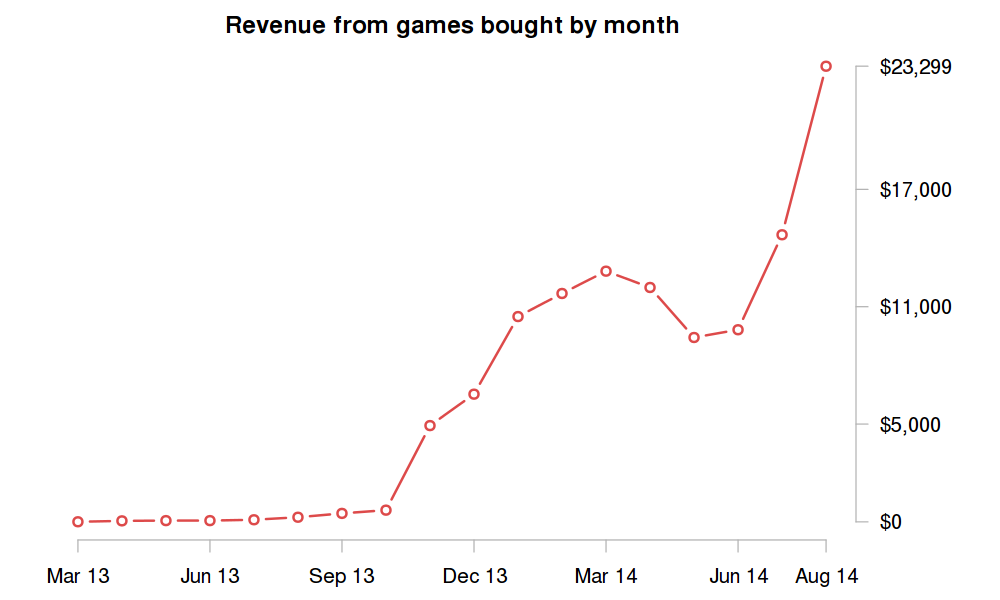
This chart shows how much has been paid to developers since the site’s launch.
The first few months were quite a drought. You might be asking what happened to
bump the revenue between September and December of 2013. Since launching the
site I was actively building new features (like game sales,
embeddable game widgets, tiered pricing among others) but
they weren’t having a significant impact. New content was essential. I got my
first games that people were actually interested in buying. (Check out Paper
Sorcerer,
FJORDS, The 4th
Wall, and Another
Perspective) Likewise, this past
month has some more higher profile games which resulted in another huge jump.
That doesn’t mean that adding new features isn’t imporant. I’ve built a
reputation as a site that constantly releases new
functionality and that definitely has helped in
building trust with the developers that use itch.io
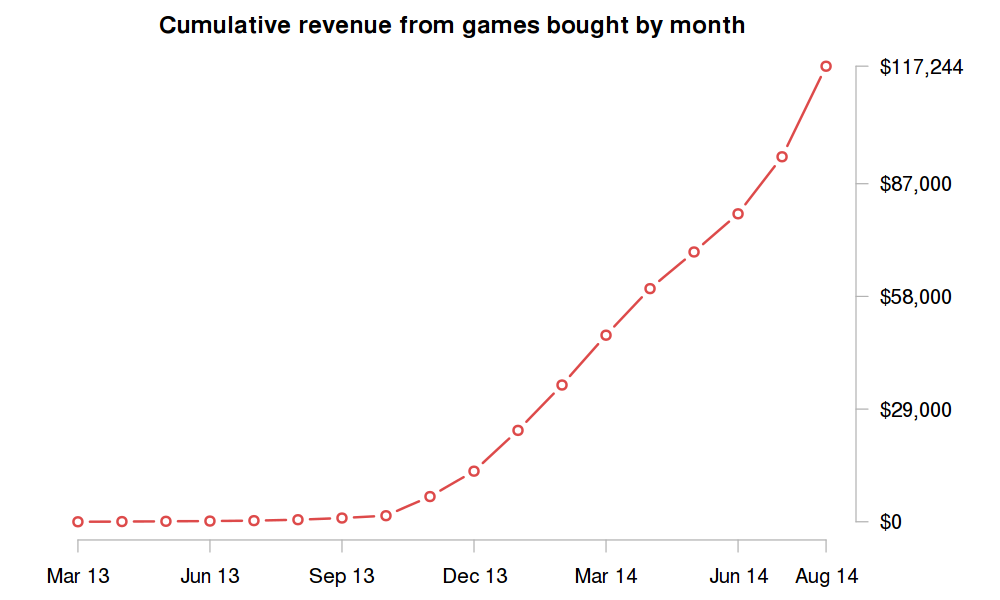
I’m happy to say that itch.io has helped developers earn over 100 thousand
dollars since launch, here’s an cumulative chart of the revenue up until
August. I’m excited with the current growth and hope to keep it up as the site
expands.
Payment providers
As mentioned above, itch.io utilizes three separate payment providers for all
transactions. The users of the site must manually link each payment provider
themselves, itch.io currently does not collect any money on behalf of the
sellers.
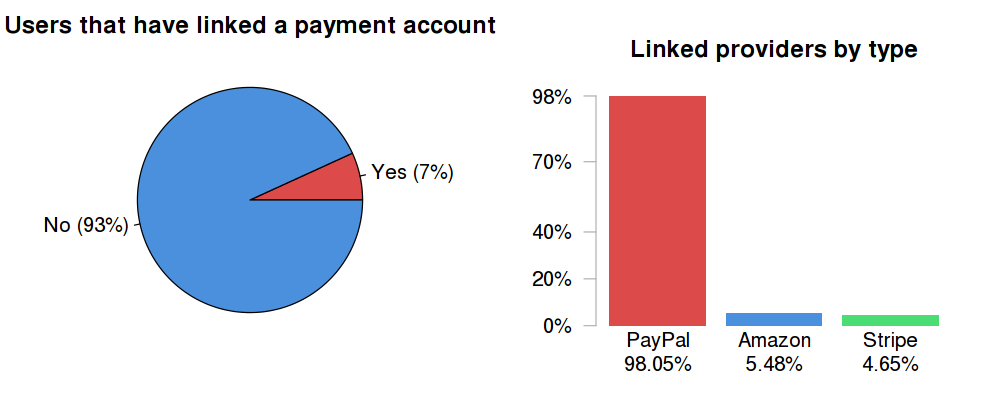
Only 7% of registered users have linked a payment account. People who don’t
link payment accounts include those that wish to distribute free games without
accepting donations, users who are buying games, and those that have created an
account to submit to a game jam.
Of the 7% of users that have linked a payment account, 98% have linked to
PayPal, 5.5% to Amazon Payments, and 4.6% to Stripe. (These sum up to more than
100% because a single user can link to multiple providers)
PayPal definitely has the lowest barrier to entry, and most likely the largest
user base, hence the domination among sellers.
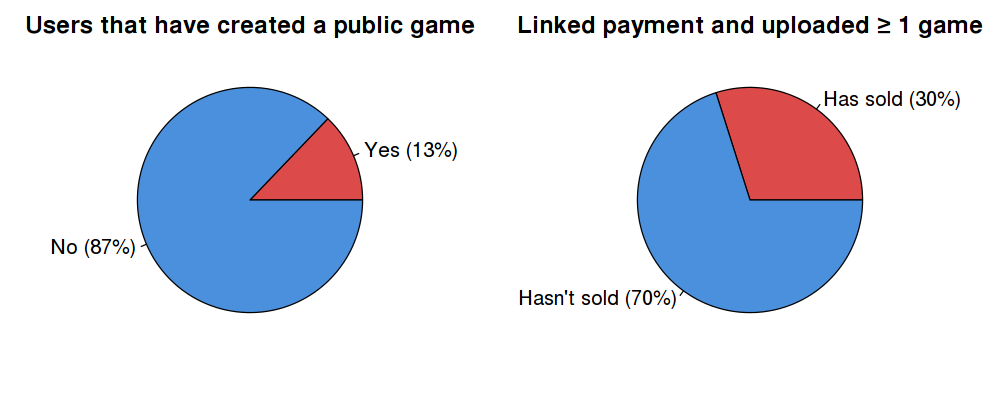
Of all registered users only 13% have uploaded a public game. This suggests
that the majority of users that have registered are more interested in playing
games than distributing them. A nice indicator of where future development time
should be spent as itch.io currently is primarily for sellers.
Additionally, combining the data from the previous two graphs, about 50% of
those who have uploaded a game have linked a payment provider.
Lastly, of those who have both uploaded at least one game and linked a payment
provider, about 30% have had at least one purchase. This considers any games
that can accept money, including those that are free.
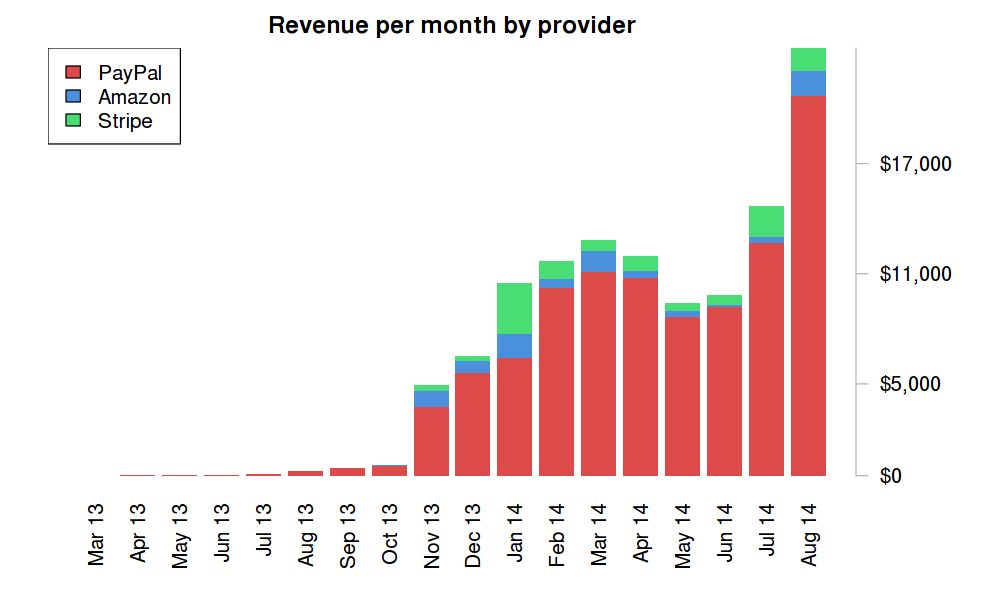
Next we can break apart the revenue graph by the provider. Naturally PayPal
dominates due to being used by 98% of sellers. A nice observation is that
Stripe has a decent proportion of sales despite only being linked by 4.5% of
sellers.
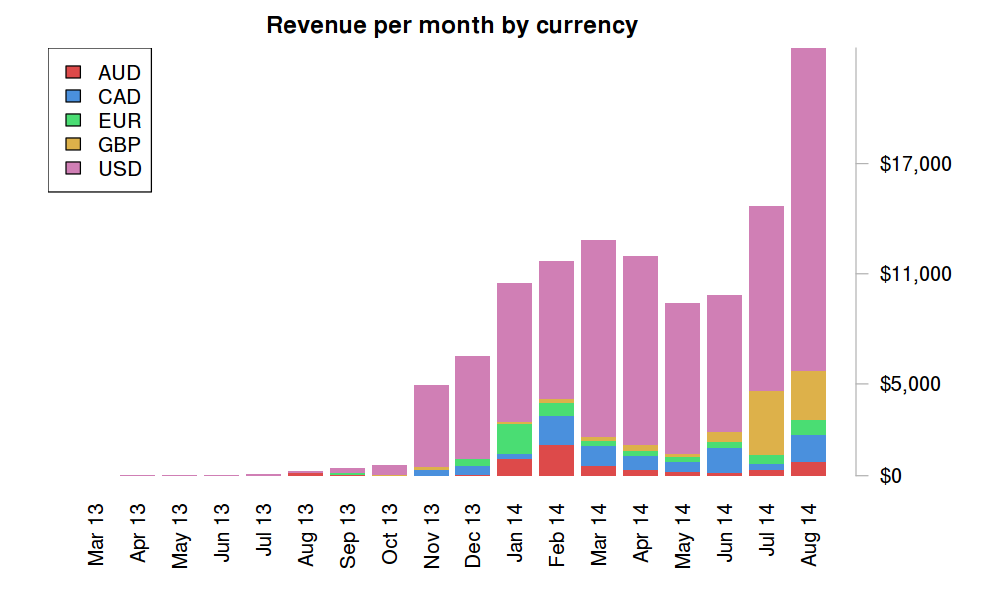
We can also slice the revenue graph by the currencies used. itch.io supports
all the currencies that the payment providers allow (view them
all).
USD is the dominating currency, and GBP has been showing some recent growth.
When itch.io launched it only supported USD (my native currency). This graph
suggests that about 20% of purchases are non-USD, so adding additional
currencies was definitely worth it.
Payment sources
More recently I gave sellers the ability to see where their purchases are
coming from. I classify all purchase as one of two top level types:
internal and external. Internal purchases are generaated from clicking through
from pages on itch.io, like the browse games page or user profile
pages. External purchases are generated by clicking into an itch.io
game page from another website or from interacting with the embeddable game
widget or the game purchase popup API.
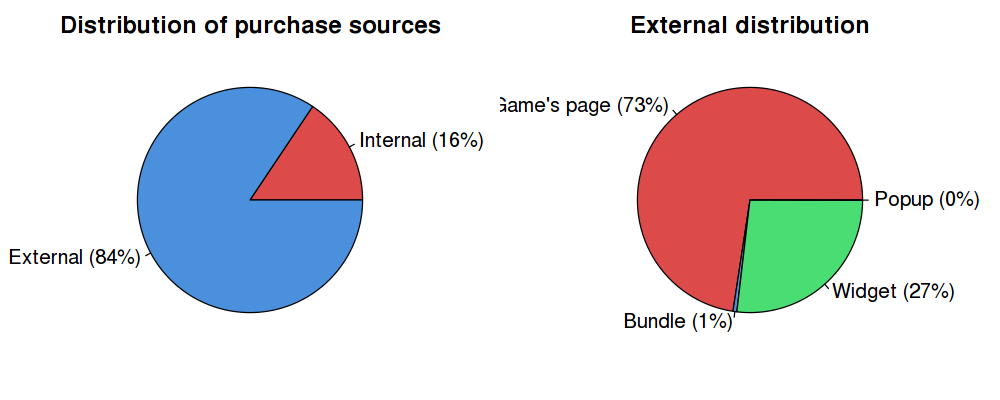
84% of purchases are from external sites. Originally itch.io had no way to
browse games, the philosophy was that the site would provide the tools but not
the distribution. I’ve since changed my mind and added plenty of ways to
discover games on the site. I’m not sure what my target
percentage for internal purchases should be but I’m actively trying to increase
it with features like the recently released game recommendation
system.
To me, it’s an indicator of how well I’m doing in distributing games. I get
very excited when I release a new way for people to discover games and it
results in additional purchases that might have otherwise never happened.
External purchases have two pieces of data associated with them: the site that
led to itch.io, and the feature of itch.io that was used to complete the
purchase. I graphed the distribution of the feature used above. 73% of buyers
land on an itch.io game page (example),
followed by 27% using the embeddable widget
(example). The popup API is used by very few
users and thus generates very few purchases. It accomplishes the same thing as
the widget so currently there’s no incentive to use it. (It was released before
the widget)
The Bundle purchases include purchases completed on the new game bundles
feature. A
small percentage of users are eligible to use bundles as they only work for
single developers with multiple games for sale. I’ll conclude from the data
that single developer bundles aren’t adequate and I’ll likely have a
multi-developer bundlesystem coming out soon.
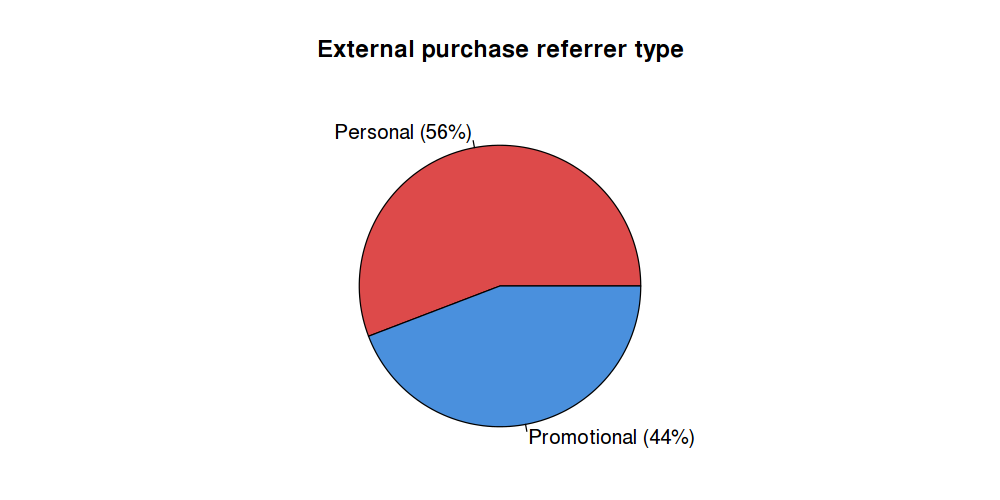
For external purchases I decided to classify the referring sites into two
groups: personal and promotional. Referrers classified as personal
include sites that the game developer owns, like their homepage or a blog
they’ve created. Promotional sites includes gaming journalism sites and other
sites designed for many people to distribute their content. This includes
Twitter, Reddit, Rock Paper Shotgun, Kotaku, among others. 44% of external
purchases come from promotional sites.
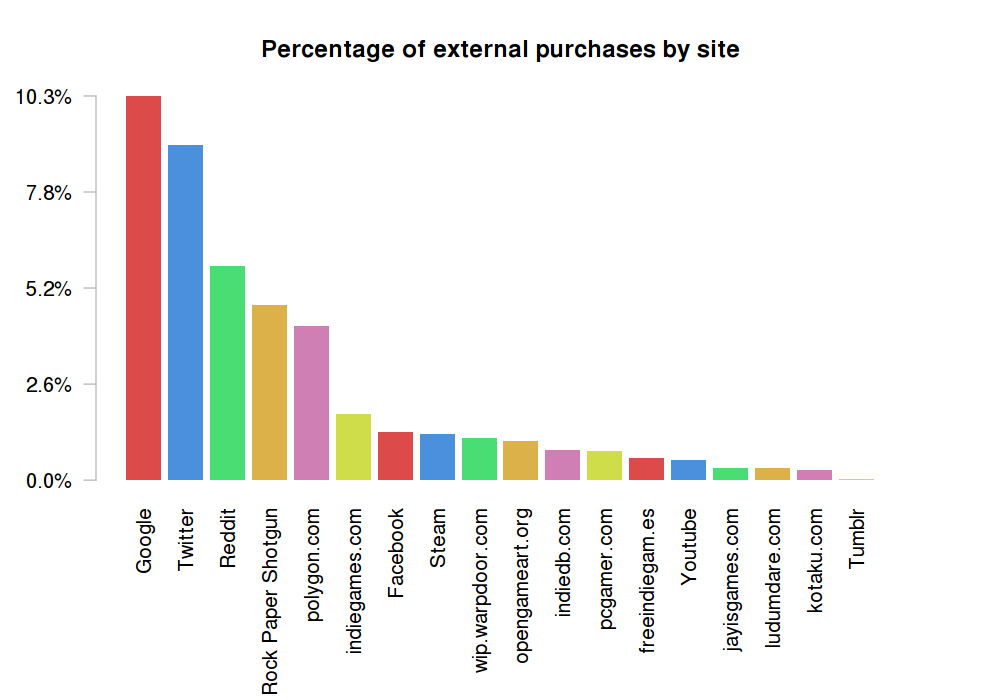
Google generates the most purchases. All Google traffic is served through HTTPS so
I don’t have any more referrer data than just the domain. Because external
purchases are only counted when landing on a game’s specific page (and not a
generic browse page) I’m concluding that it’s people searching for a specific
game by its name. Maybe they heard about it somewhere or saw it before and
have finally decided to buy it. I like to think I do a pretty good job of SEO
for all pages on itch.io, so it’s nice to see that people are finding the games
from Google. If you have your game uploaded to itch.io then you should
definitely see it in the top results when searching for its name. I’m curious
if long tail searches end up matching the game descriptions provided by the
developers, but without search query data I really can’t tell.
Twitter generates the second most purchases (or at least the t.co short links) at 9%
of all external purchases. If you’re an indie game developer you definitely
should be on Twitter and talking about your game. (Especially since I promote
a ton of people’s games on Twitter).
Reddit is in third with about 6% of external purchases. There are a lot of
indie game related subreddits, so definitely consider reddit when planning to
market your game. I’ll have information about where to do it below.
Rock Paper Shotgun is the first games
journalism site in the list. They have generated a nice 5.5% of external
purchases. If you’re contacting game journalists about your game I would I
recommend RPS. They appear to be one of the most indie friendly out of the
higher traffic journalism sites.
Polygon is the second games journalism site, close
behind RPS. Danielle Riendeau
is one writer that I’ve seen write about itch.io games frequently recently.
Both of these sites have writers with press accounts on itch.io so opting in
to the press
system
is another viable approach.
All the others are significantly less than the top 4. Seeing Steam there is
interesting, the majority are from itch.io links posted to Greenlight pages. I
suggest using the list of sites above as a starting point for finding new
places to market your games.
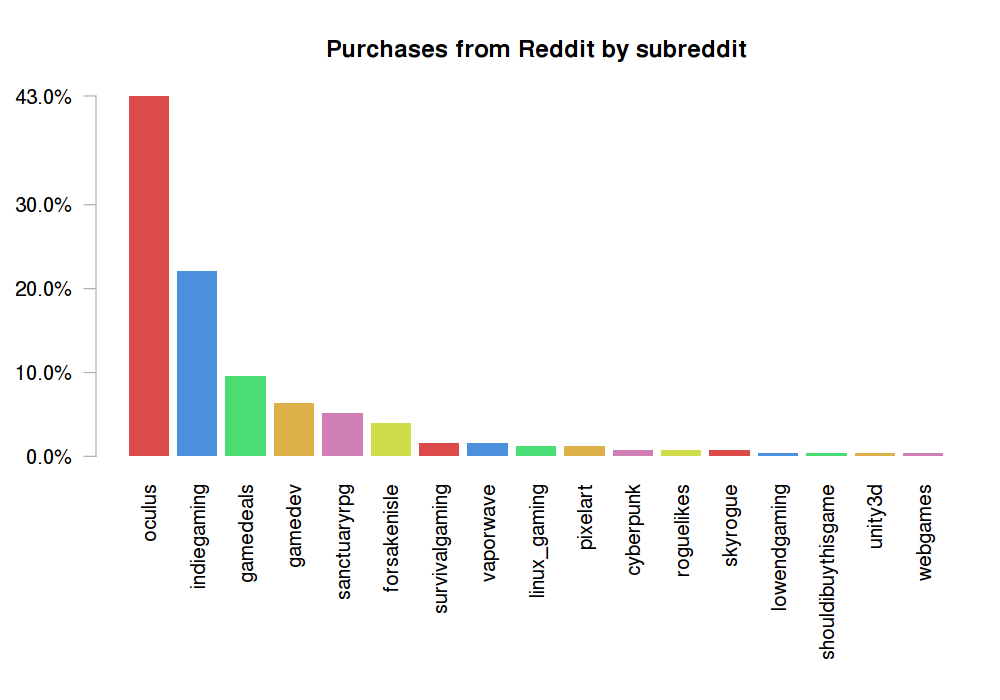
Here I’ve graphed all purchases originating from Reddit distributed by
subreddit. I think /r/Oculus is a slight
outlier here. There were a few popular Oculus
games that had been released on itch.io.
Regardless, if you’ve got an Oculus game then you should consider a post there.
/r/IndieGaming,
/r/GameDeals and
/r/gamedev are all great generic subreddits
that have a lot of indie game activity. My suggestions are to check out
/r/indiegaming when releasing your game, /r/gamedeals when your game is going
on sale, and /r/gamedev when you want other developers to give you feedback
about your game. Of course, check out Reddit’s
rules and the rules of the respective subreddit
when posting to ensure any post you make contributes to the community. Also
check out this interesting post about the 10% guideline for self
promotion.
If your game is paid only then I definitely recommend handing out download
keys
as well.
The other subreddits listed are also great candidates for exploring when
marketing your game. You’ll also notice a few game specific subreddits, so
creating a subreddit for your game is another viable option.
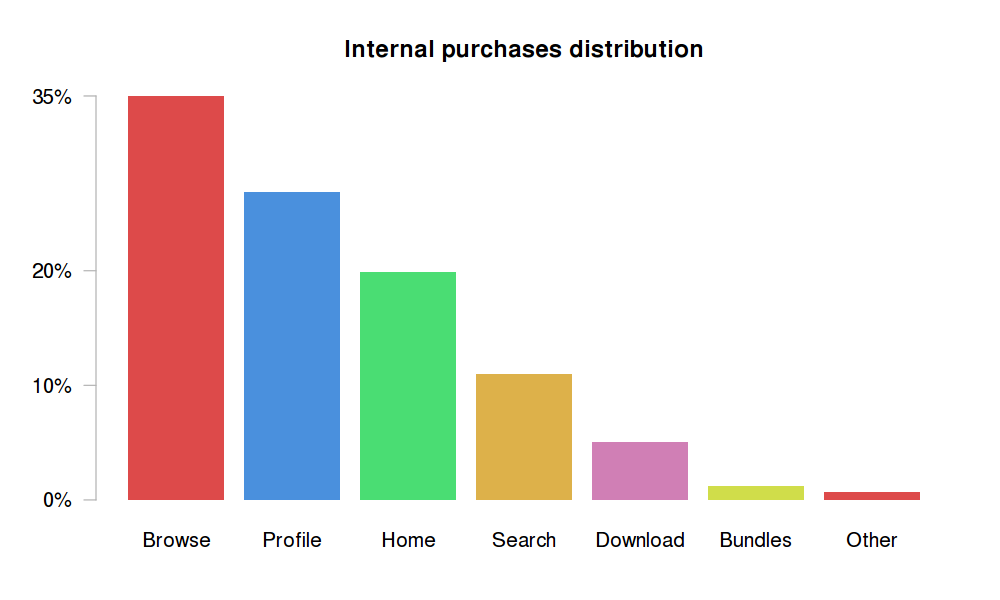
Let’s check out where internal purchases come from. The browse
pages make up 35% of all internal purchases. The browse
pages are uncurated and provided a multitude of facets to filter games. The
browse pages show the more active and popular games first. The popularity
algorithm is rolling, so if a game gets put on top it won’t stay there forever
unless it continues to get a lot of attention.
Profile pages are a surprising second, with about 30% share. itch.io’s profile
pages only come with basic customization, and aren’t really promoted
anywhere. From what I can tell, these purchases are originating from people
linking to their profiles from external sites, like in tweets and Twitter bios.
This is definitly a good indicator to me that I should spend some time updating
the profile page customization options.
The homepage is in third with about 20%. The homepage is a manually curated
collection of games that I put together. I try to pick content that people want
to see. There is only one homepage but many browse and profile pages. I think
I’ve done a decent job of picking games so far, but there are many things I
want to try. One idea I’m excited about trying is giving the homepage to a user
for a day to promote a collection of games they think is cool.
The Download bar is an interesting one. I recently added a grid of
recommended games at the end of the download flow for free games. It’s nice
to see people converting to a purchase after picking up a game for free. The
Bundes bar is for any bundles bought from visiting the bundles browse
page.
Payment types
itch.io has a handful of ways to sell a game in addition to just providing a
single price for some files. For downloadable games you can set prices on
individual files and can run a
sale. If you have multiple games you can
sell them together in a bundle. You can buy a game
as a
gift.
If your game is free you can still sell it, with a pay-what-you-want minimum
price of 0. It’s kinda like donating except that the person buying gets a
download key that gives access to updates if they game goes paid later.
Additionally, for embedded web games, you can add a “Support this game” button
which functions as a donation. Lastly, it’s possible to combine the two into a single page with web and downloadable versions.
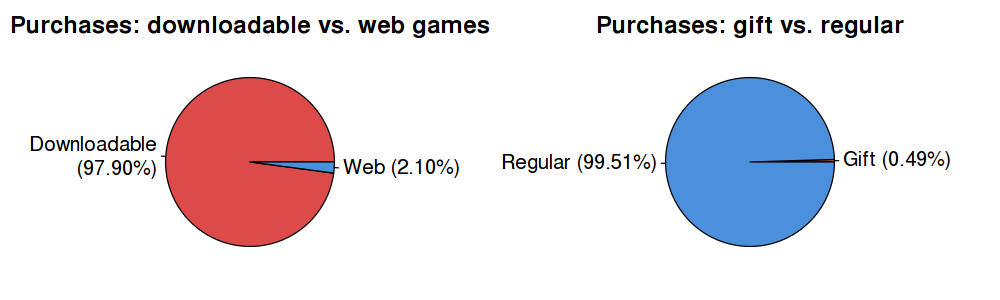
The majority of purchases are for downloadable files. Very few people use the
“Support this game” button for embedded web games. Additionally, gifts are
rarely used. I’m a little disappointed in the adoption of gifting, I might try
to push them more to see if I can get some more usage out of them.
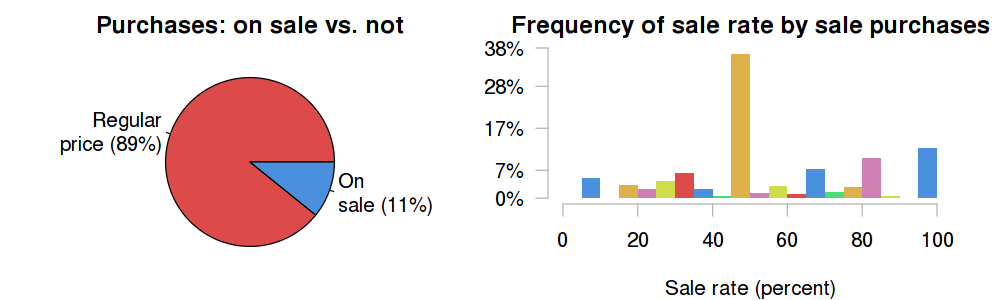
11% of all purchases are take place while a game is on sale. I have
a feeling that putting a game on sale increases the conversion rate just
because of the perceived value. I think it would be nice to experiment with
getting more games to be on sale at a given time.
I also graphed the distribution of the % off for all on sale purchases. The
majority of those purchases are when the game is 50% off. Something interesting
about this graph though is the second highest amount, 100%. 100% means the game
is free and can be downloaded without purchasing. To be considered in this
graph, though, a purchase must be completed. That means people are still paying
even though the game is temporarily free.
Payment amounts
Because all purchases on itch.io are pay-what-you-want above the minimum the
buyer has to decide how much they want to pay.
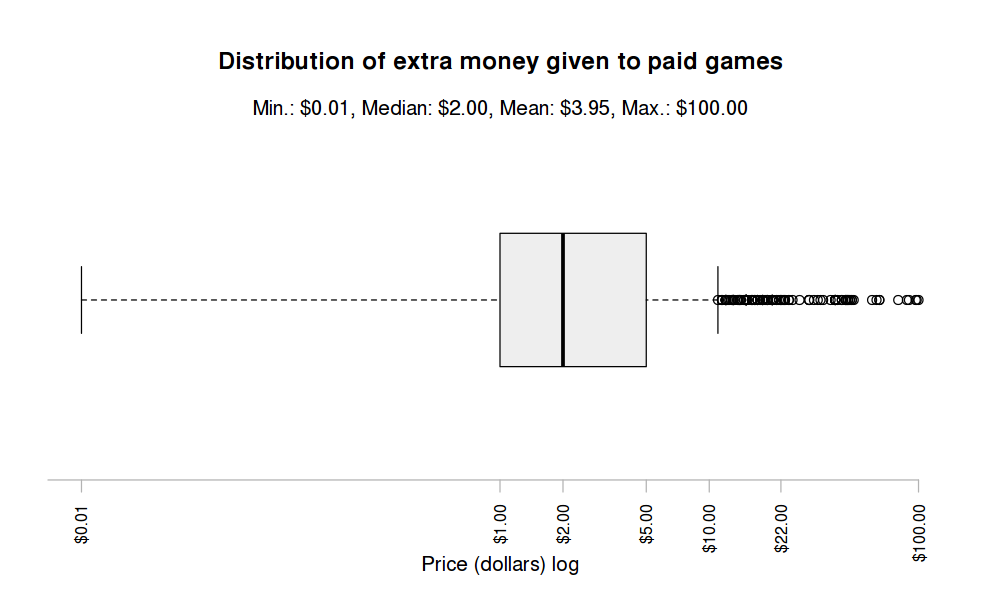
I graphed a box plot of the extra money given to paid games when extra money is
given. Here’s a quick guide on how to read a box
plot.
The median of extra money given is $2, that’s pretty good as the median
price of all games is $2 (a 100% increase). In one instance a person gave $100
extra when buying a game, along with a few others who gave in that range.
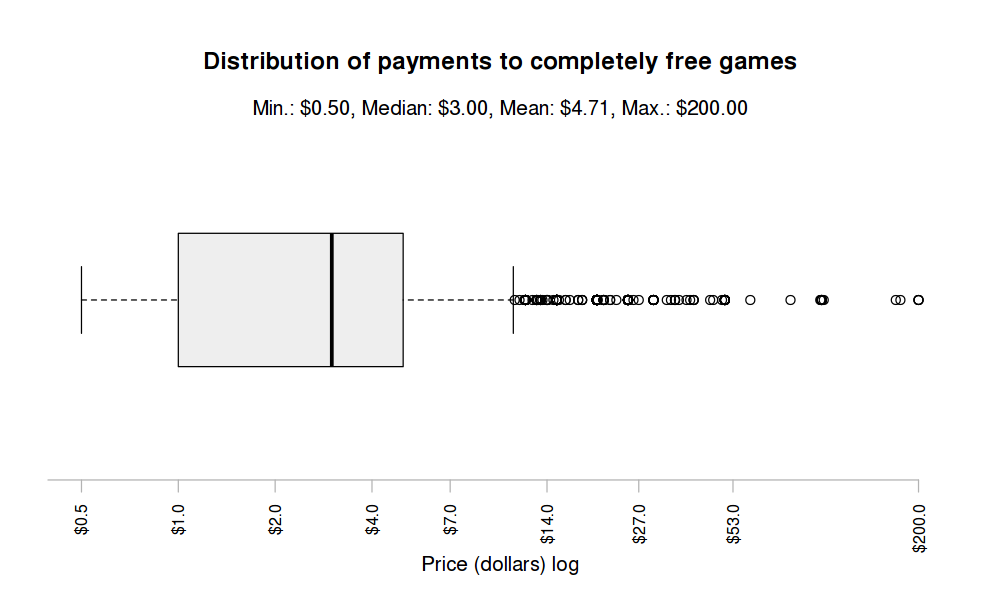
When a game has a minimum price of 0 it can be downloaded for free but the
downloader is given the option to pay. The above is a box plot for the payments
given to free games. It appears that when a game is free people are even more
generous. The median payment is $3 and there has been someone who has paid
$200 for a free game!
Game types
itch.io supports a wide range of game types, from downloadable to Unity, Flash,
Java and HTML.
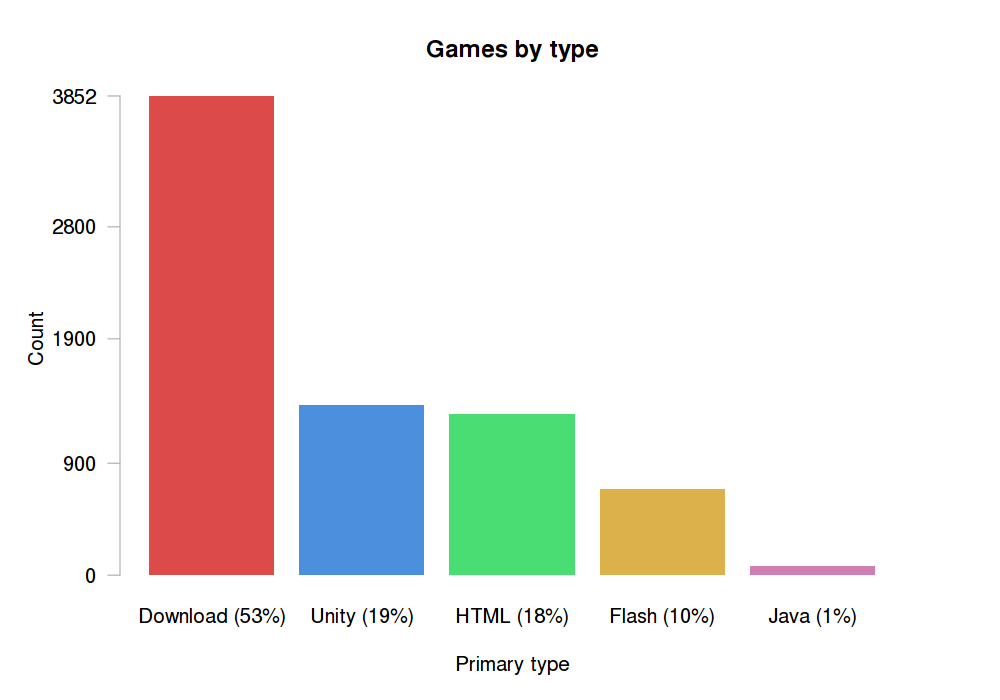
We can see here that the majority of games, 53%, are downloadable, and rest are
embedded web games. This graph doesn’t account for web games that have
downloads available, it just considers the primary type of the game. Unity and
Flash are the most popular web types. Flash has been declining in usage the past
few years and it definitely shows. Lastly, hardly anyone uses Java on itch.io.
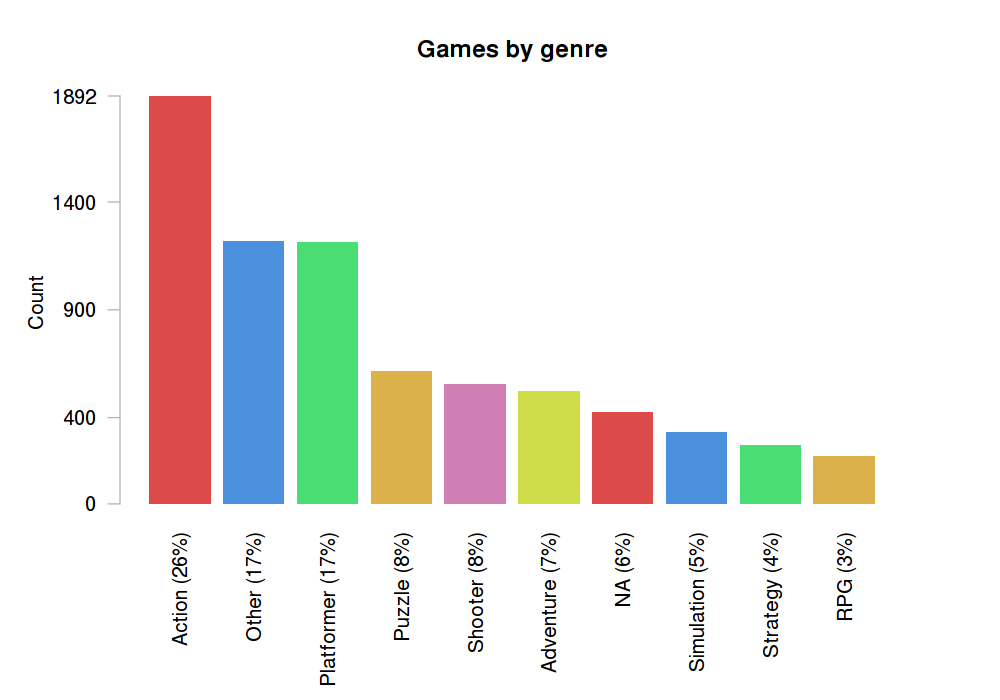
When uploading a game, the author is given an option to choose a genre that
best fits their game. Here is the distribution of genres. Action is most
popular, followed by other. I would say I probably need more genre choices if
other is the second most chosen option.
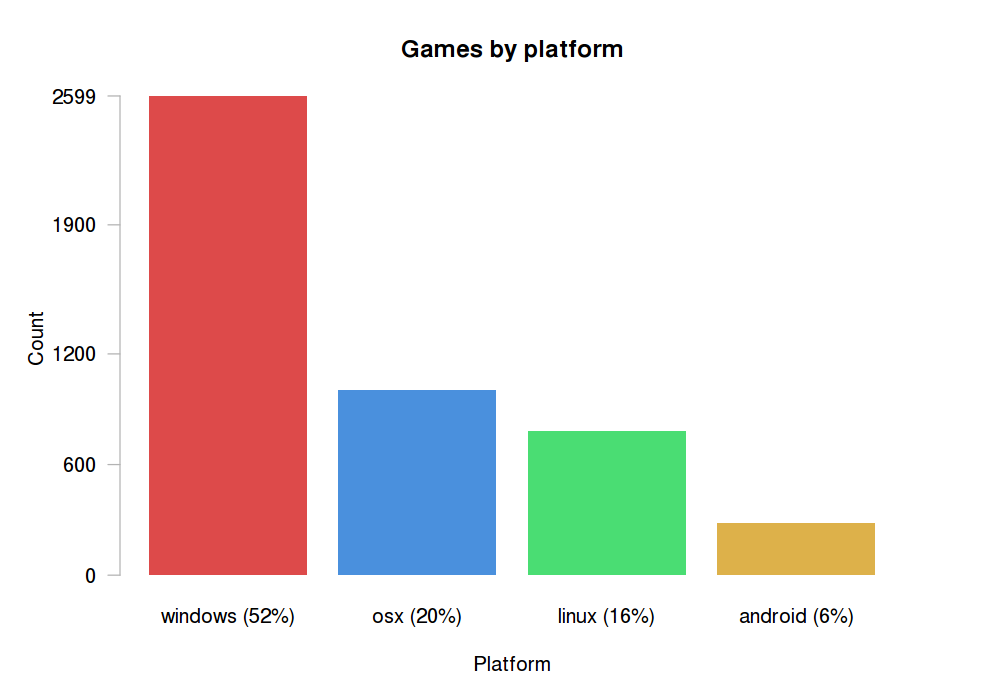
Downloadable games are can be assigned the platform(s) that they run on. Here
is the distribution of platform choices. Windows games are most frequent,
followed by OSX and then Linux. No surprises here. Windows dominates by a large
margin.
Expenses
I currently don’t charge anything for itch.io, so I keep close watch on my
costs so I can plan for an appropriate time to start collecting money.
itch.io’s infrastructure is fairly basic: two VPSs, Cloudflare, and Google
Cloud Storage. Cloudflare is 20 dollars a month, each VPS is around 15 dollars
a month. ($60 a month total) (Additionally two domains, and some one time costs
for things like shirts and a logo)
The majority of cost comes from storage and bandwidth on Google Cloud Storage.
Effectively, the more people download things the more money I pay.
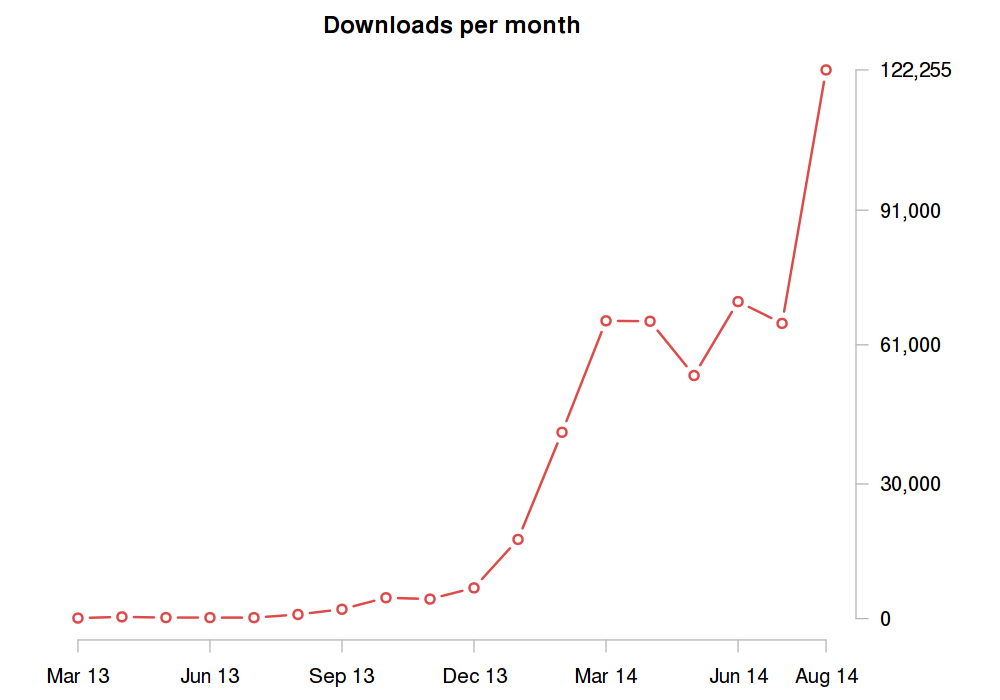
I graphed the monthly downloads. This does not include web games, so there’s
actually quite a bit more bandwidth going to Flash, Unity, and HTML games not
in this graph. Downloads have gone up about 100% from July to August.
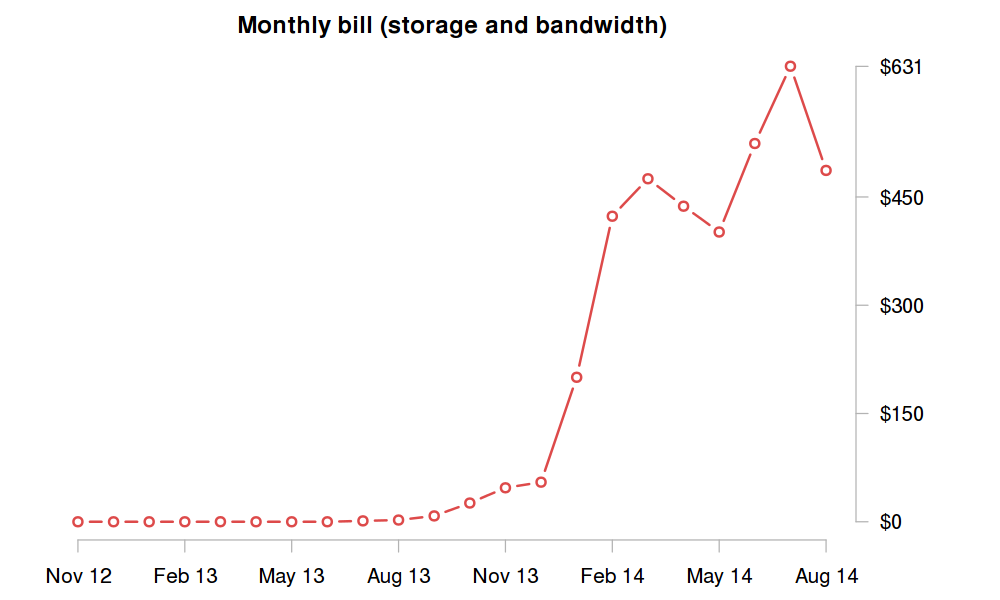
Here are my monthly storage expenses. I anticipated the rising cost and built a
caching layer in front of free games running on one for my VPSs using Varnish
and their new streaming support. I released it about half way into August, so
the savings next month should be even greater. It has about 90% hit rate which
is awesome! Considering the huge increase in downloads yet decrease in monthly
cost I’d say it was a good investment of time.
Thanks
Thanks for checking out itch.io and this post, I’m glad you made it to the
bottom. There are a lot more things I want to graph with the data I’ve
collected so I hope to do more posts like this. At the very least I’ll have
updated versions of these graphs as time goes on. If you liked this, or you
want to support itch.io, then buy some games: (or if you have a lot of $$ and
really want to support itch.io then you should get in
touch :))
Thanks
P.S. Follow me on Twitter, I post a lot of data and experience: @moonscript
[ad_2]